Airspace performance dashboard

This dashboard presents an overview of how London Gatwick and its airlines are performing in key noise abatement areas for arriving and departing aircraft. Namely, Continuous Descent Operations (CDO) for arrivals and departure track keeping.

Noise monitor dashboard – overview

Everyone encounters sound every day. It is only when that sound causes an adverse effect on a listener, such as annoyance, does that sound become noise. Noise is not always just about how loud the sound is, there is a complex set of factors that drive annoyance both based upon the noise itself and what that noise means to us. You can find out more in the following video:

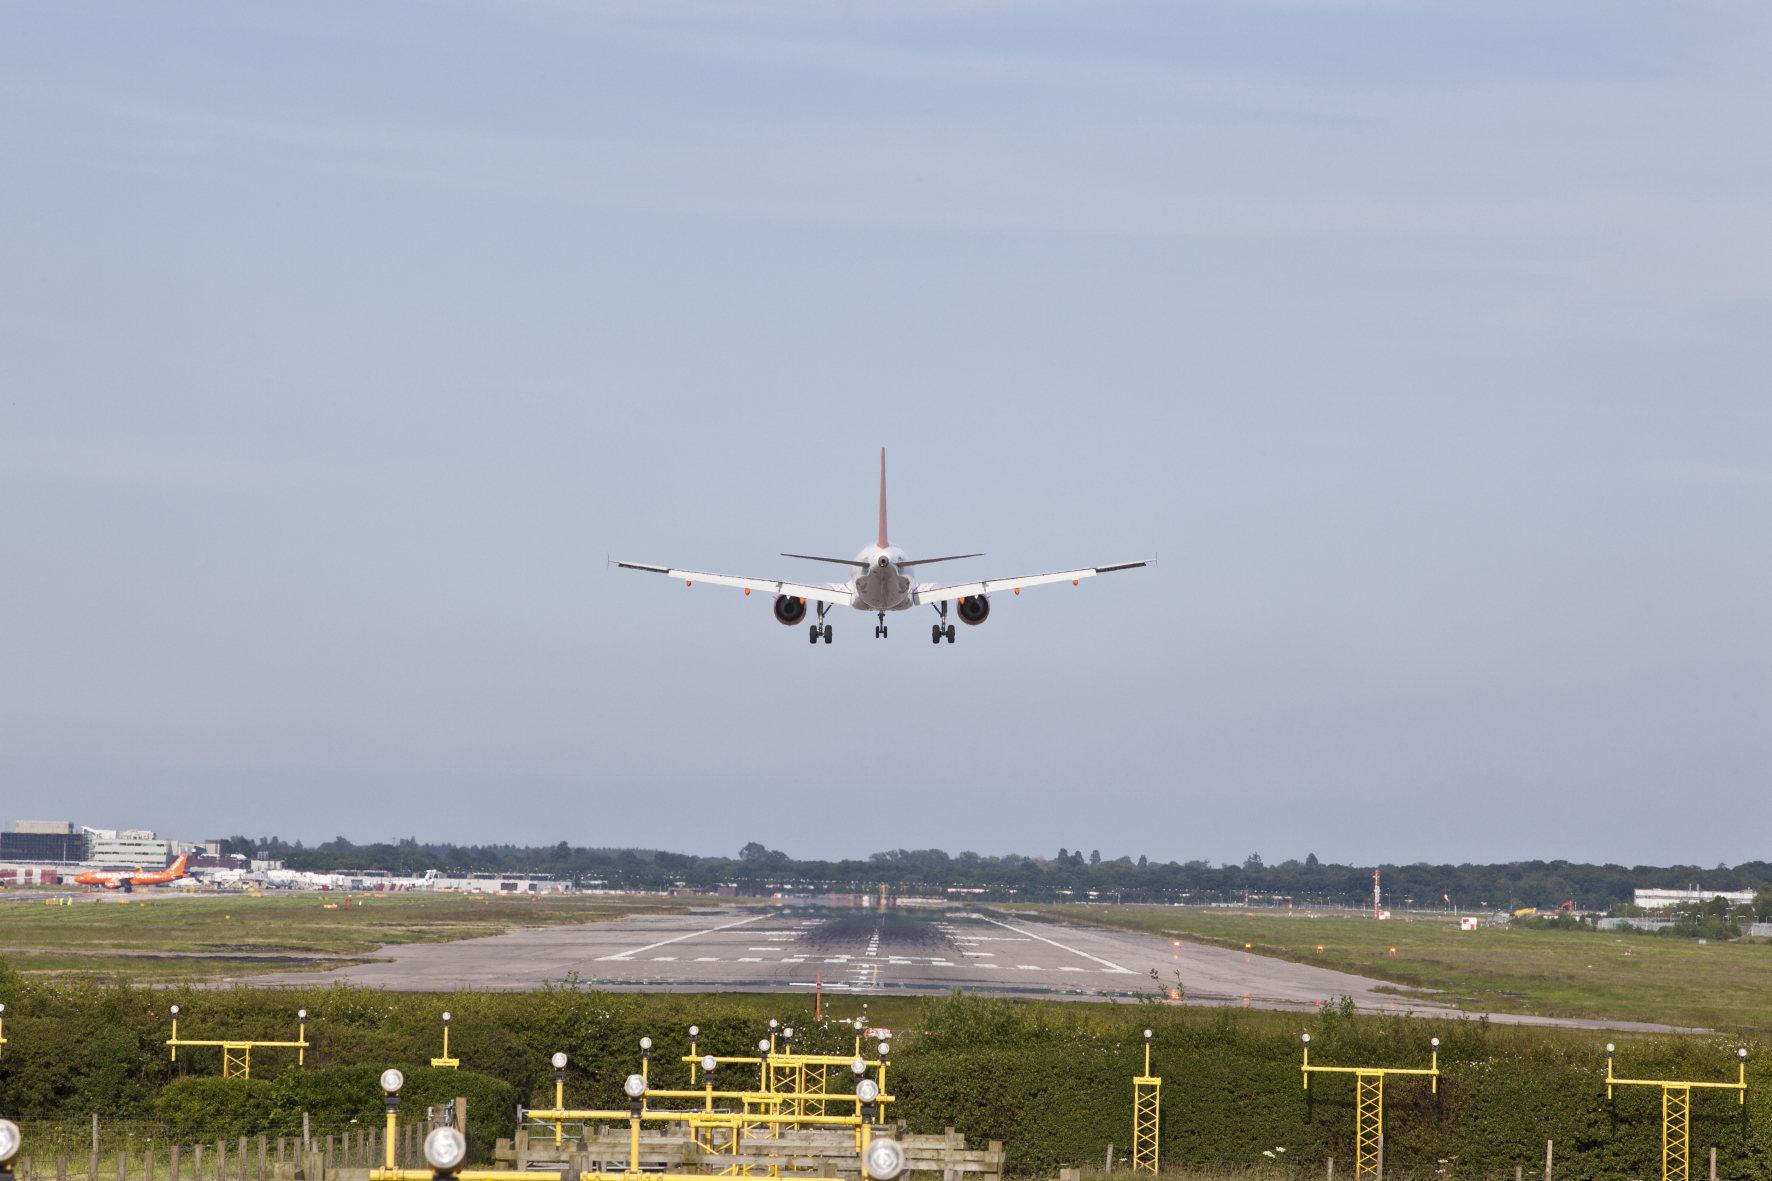
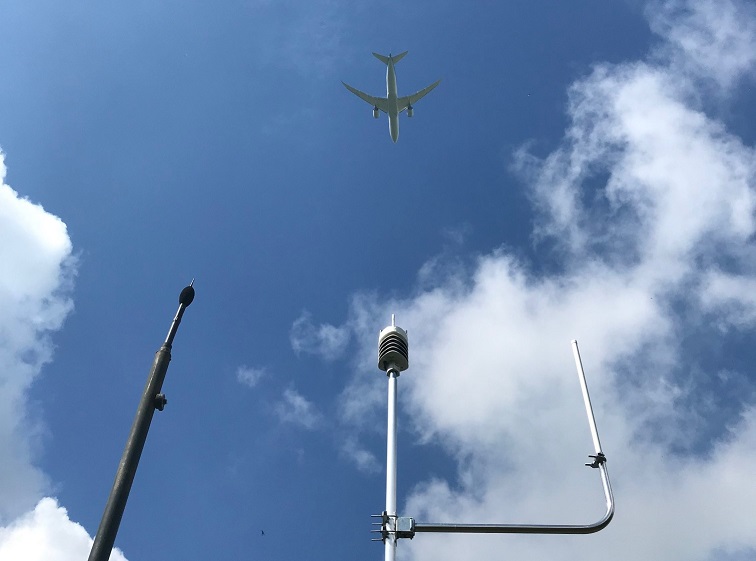
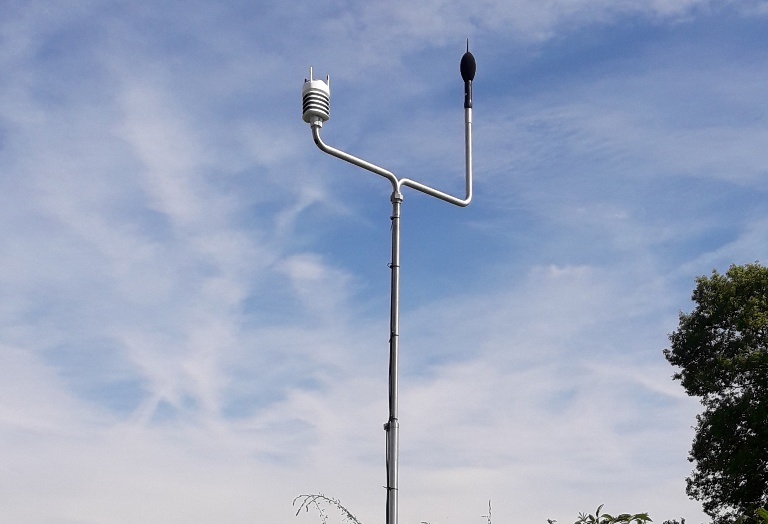
To understand the noise impact on the local community the airport has a number of fixed or temporary noise monitors deployed in the local area, generally under or near flight paths. The monitors detect and send the noise levels every second 24 hours a day, 7 days a week to a central system.

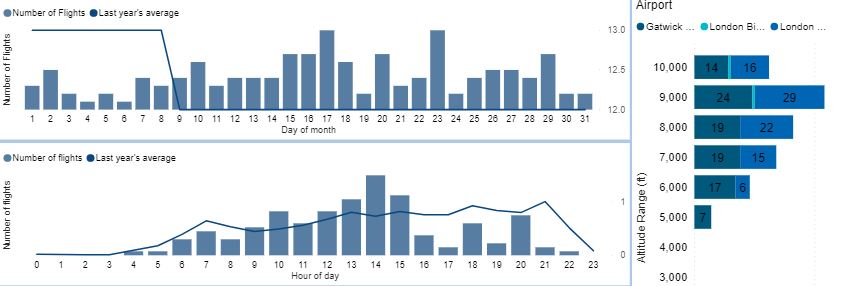
This dashboard presents an overview of the data collected by the noise monitors deployed in and around the London Gatwick area. If you select a single monitor, more detailed analysis is available.

A more detailed breakdown of for each noise monitor is available in the detailed dashboard.

Noise monitor dashboard – detailed

This dashboard presents a detailed breakdown of the data collected from our fleet of noise monitors. It only shows one monitor at a time, but you can choose your nearest monitor from the drop-down menu.

An overview of the data collected by all of the noise monitors is provided in our overview dashboard.

Noise complaints dashboard

This dashboard presents an overview of the aircraft noise complaints submitted to London Gatwick. All data is anonymised and is presented here to provide a summary of the data from areas around the airport:

Detailed dashboard for your area

Pulling together much of the other panels for frequency of flights, regularity, and altitude, this detailed dashboard compiles it all into one space for your review.

Additionally here, we include aircraft category – what type of aircraft they are, whether this is small civil aviation (propeller driven), or business jet, helicopter, commercial jet, or even military.

Information regarding the source of the overflight is also displayed, which is especially useful if there is more than one airport in your local area.

Our current noise contour

The following map shows the 2023 noise contour, produced by the UK Civil Aviation Authority (CAA). Using the slider on the map, the various contours can be viewed. The area of the 2023 summer day actual modal split 51 dBA Leq 16hr contour increased by 28% to 112.8 km2 compared with 2022. In addition, the 2023 summer day actual modal split 54dBA Leq 16hr contour increased by 18% to 32.1km2 compared with 2022. It should be noted that in 2023 London Gatwick operated around 90% of the traffic compared to 2019 due to the effects of the COVID-19 pandemic on air traffic levels. Flight numbers have continued to increase year on year through the post-pandemic recovery which is why the contours have increased compared to the previous year.

The full report from the UK CAA ERCD can be read in full here.


How our noise contours have varied

Over the last 20 years, the aviation industry has seen substantial improvements in aircraft design, engine technology and operational procedures. ​

The following map shows how our noise contours (57dB Leq day standard) have varied over the last 20 years. Over that same period, the number of aircraft movements have also changed as follows: