How we calculate overflight

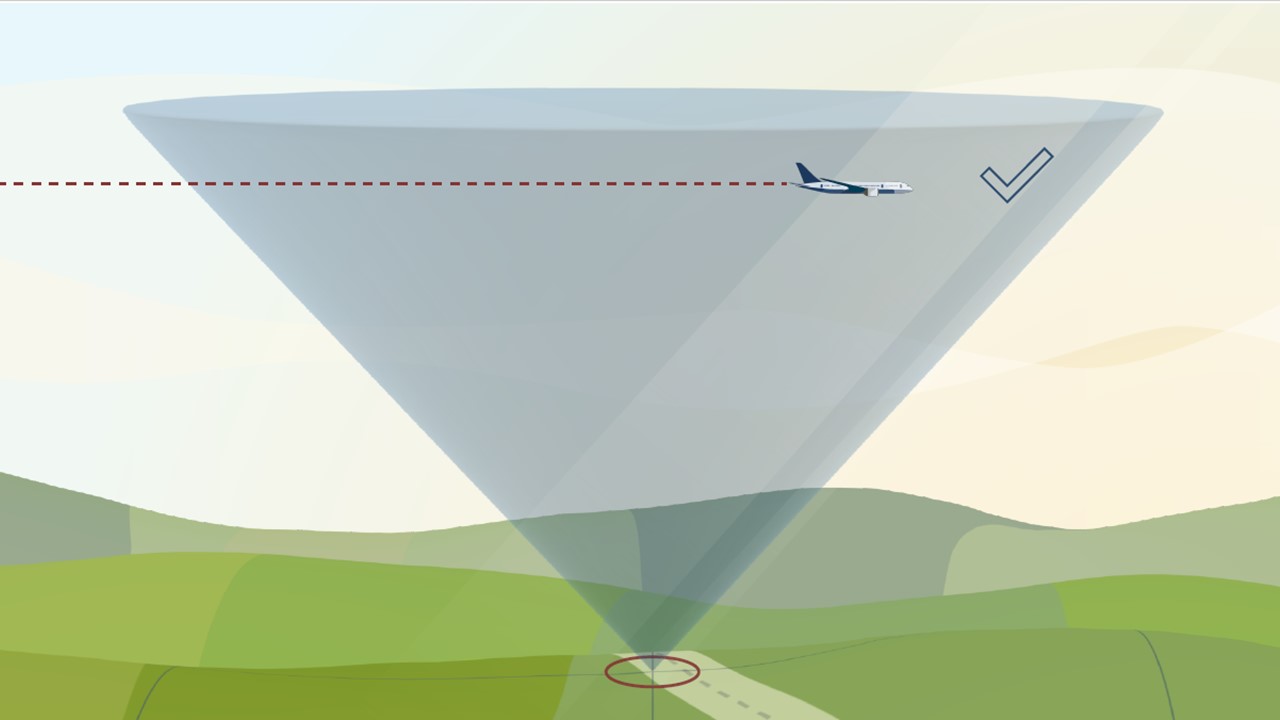
An aircraft flies within the analysis cone and is successfully counted

The following video explains how our system calculates location-specific data used on this website:

1km x 1km grid over the local area to show how we divide up our analysis

The grid

To be able to analyse the number of flights over an area around the airport, we have created a grid of identically sized, 1 kilometre by 1 kilometre squares which extend for up to 50 miles from London Gatwick.
How we count the number of flights

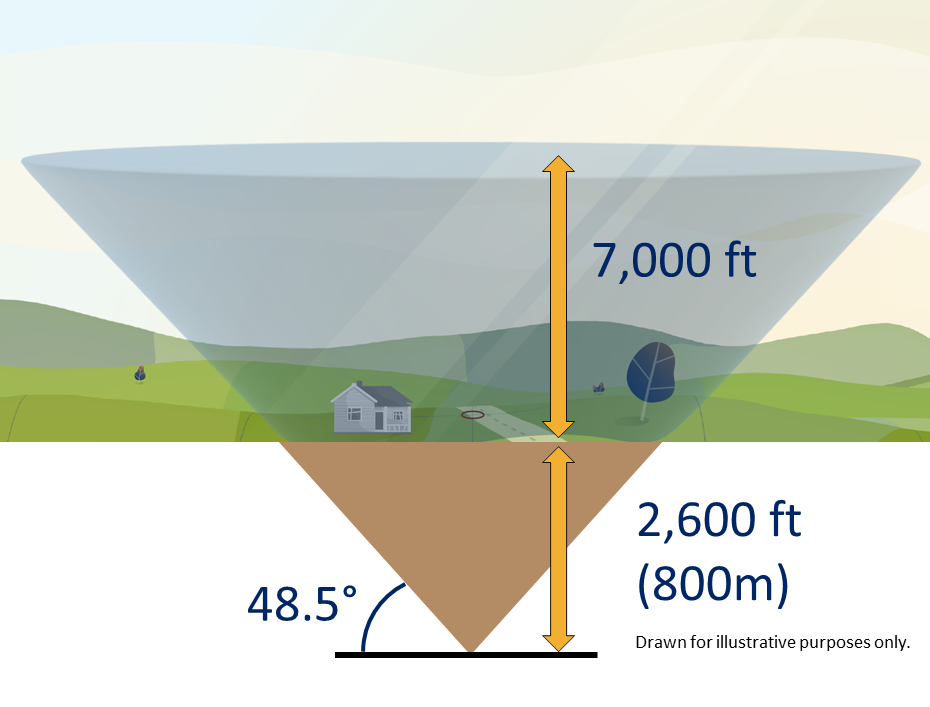
We start by drawing a cone at the corner of each grid. Using the location that you provided when you entered the site, we determine the nearest cone to you.

Flights that pass through each cone are recorded and that data is presented on this website.

To avoid underestimating the flights in each area and to fully cover all locations in our grid, we lower the cone 2,600 feet (800 metres) into the ground. The cone extends up to 7,000 feet (2.1 kilometres) above local ground level and at the very top, the cone is over 5 kilometres wide. 7,000ft was chosen as an upper altitude limit as according to the Air Navigation Guidance, this is the highest altitude for which noise management is prioritised above or equal to greenhouse gas emissions.

Why we use a cone

We use a cone because research undertaken by the United Kingdom Civil Aviation Authority identified that a cone best aligns with how we determine if an aircraft has overflown a location or not.

The 48.5-degree angle of the cone was selected as it incorporates an evaluation of noise, in that if one aircraft flew directly above the observer, followed by a second aircraft off to the side along the 48.5 degree line, the second aircraft would be 3 decibels quieter than the first.

Where does the data come from?

All data used in our system comes directly from the London Gatwick Noise and Track Keeping (NTK) system, which receives flight data from Air Traffic Control radar.

How many aircraft fly near my area?

The following chart demonstrates local air traffic around your area – total flights per day for the month. The number and type of flights over your location can vary, even on different days, which is driven primarily by wind direction and hence the operating mode of the airport – the flow.

You can easily determine if an aircraft is overflying your area by looking for the tail, if you can see the tail, chances are the aircraft is too far away from you to be counted in our statistics:

Mousing over the chart will give you detailed figures. Historical flights from previous months are available via a drop-down. The data is refreshed monthly with new data available typically in the middle of each month. Please keep this in mind as the most recent datasets may only be partially complete.

How frequent are flights in my area?

There are a number of factors that influence the frequency of flights:

  • Firstly, the number and frequency of flights will vary on a daily, weekly and yearly basis due to differences in airline schedules. The airlines schedule flights in response to consumer demand. This is particularly the case around holiday periods.
  • Secondly, the runway in use at any given time will also vary, largely due to the wind conditions. Each runway has its own set of flight paths, and each flight path will affect different areas. As the runway in use changes, the flight paths change, and so too do the areas affected.

This chart displays the average number of flights per hour over the entire months. Mousing over the chart shows more details, with historical months available via the dropdown. As mentioned in the previous section, data is refresh in the middle of every month.

How high are flights in my area?

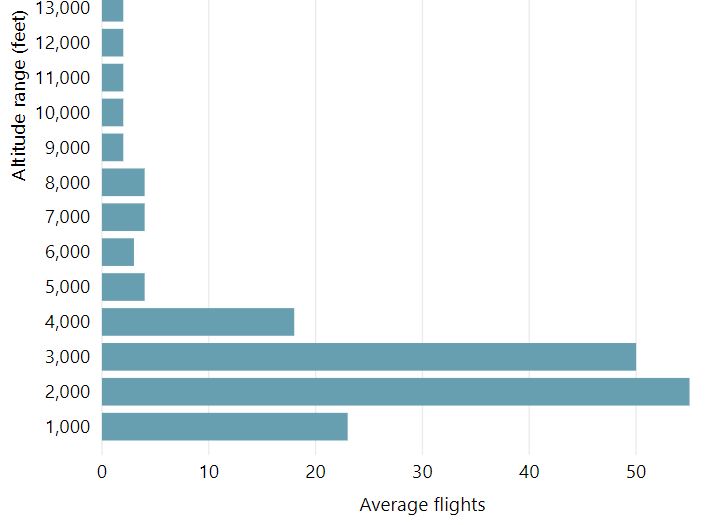
A depiction of a chart showing how many flights have flown the area in 1,000ft vertical bands

The altitude of aircraft can vary due to a number of factors. It could depend which airport the flight is going to, or from and whether it is an arrival or departure. Arrivals are typically following a steady descent to the runway whilst departures are typically following a steeper path as they climb away from the runway.

A core function of Air Traffic Control (ATC) is safety, and one of the primary ways in which this is achieved is by maintaining either lateral or vertical distances between aircraft. When close to airports lateral separation is used, but when at higher altitudes, vertical separation is used with aircraft typically separated by around 1,000ft. This can sometimes be seen in the overflight data for your area.

This chart shows the height of aircraft overflying your area in 1,000ft increments. Mouse over it for more figures and detail. A dropdown menu allows you to view historical months for comparison and trends. The data is refreshed monthly, generally in the middle of the month.

Have traffic levels changed?

Air traffic flying to and from a local airport will vary in response to a wide range of factors including, but not limited to the local weather (on the ground and in the air), the volume of traffic, the make-up of that traffic (small, large, jet, propeller aircraft etc.) and what runway is currently in use.

The following interactive chart presents, for your area, a long term view of flights to and from London Gatwick and other airports.