The following video explains how our system calculates location-specific data used on this website:

The grid
To be able to analyse the number of flights over an area around the airport, we have created a grid of identically sized, 1 kilometre by 1 kilometre squares which extend for up to 50 miles from London Gatwick.

How we count the number of flights
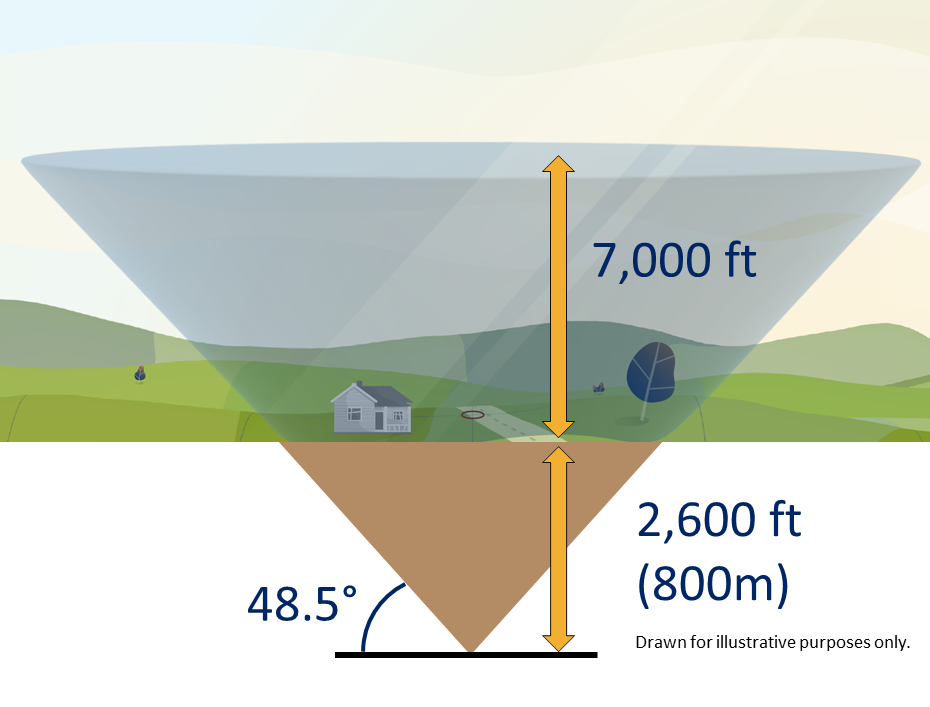
We start by drawing a cone at the corner of each grid. Using the location that you provided when you entered the site, we determine the nearest cone to you.
Flights that pass through each cone are recorded and that data is presented on this website.
To avoid underestimating the flights in each area and to fully cover all locations in our grid, we lower the cone 2,600 feet (800 metres) into the ground. The cone extends up to 7,000 feet (2.1 kilometres) above local ground level and at the very top, the cone is over 5 kilometres wide. 7,000ft was chosen as an upper altitude limit as according to the Air Navigation Guidance, this is the highest altitude for which noise management is prioritised above or equal to greenhouse gas emissions.
Why we use a cone
We use a cone because research undertaken by the United Kingdom Civil Aviation Authority identified that a cone best aligns with how we determine if an aircraft has overflown a location or not.
The 48.5-degree angle of the cone was selected as it incorporates an evaluation of noise, in that if one aircraft flew directly above the observer, followed by a second aircraft off to the side along the 48.5 degree line, the second aircraft would be 3 decibels quieter than the first.
Where does the data come from?
All data used in our system comes directly from the London Gatwick Noise and Track Keeping (NTK) system, which receives flight data from Air Traffic Control radar.


